The three factors of performance, time and costs are the basis for successful IT project management. At in-factory GmbH, we bring the expertise of target-oriented planning for successful project implementation to our customers.
MS Excel can be a helpful tool in project management, as it can simplify or automate many work steps. The pivot function is particularly useful for reporting, as it can be used to display and summarize larger data sets easily and clearly without much preparation. It often helps to use calculated fields directly in the pivot in order to save having to create auxiliary columns in the original table.
How is a PivotTable created?
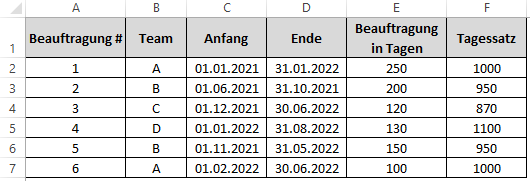
As an example, a report is created on the previous order situation of employees who are assigned to different teams. The output table looks like this:
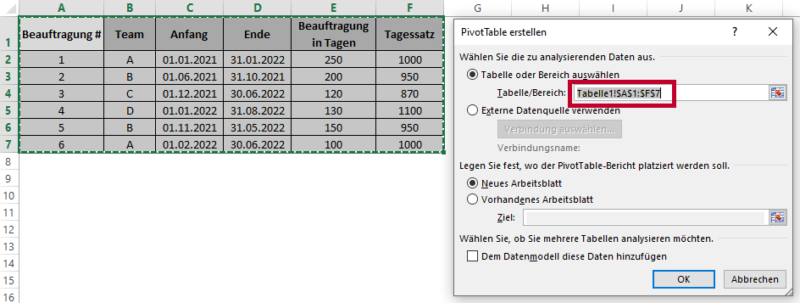
An empty pivot can be inserted at the desired position via the "Insert" -> PivotTable tab:

When selecting the data to be analyzed, it is important to also select the headers of the source table (not just the values). Then specify where the pivot is to be placed - in this case on a new worksheet:
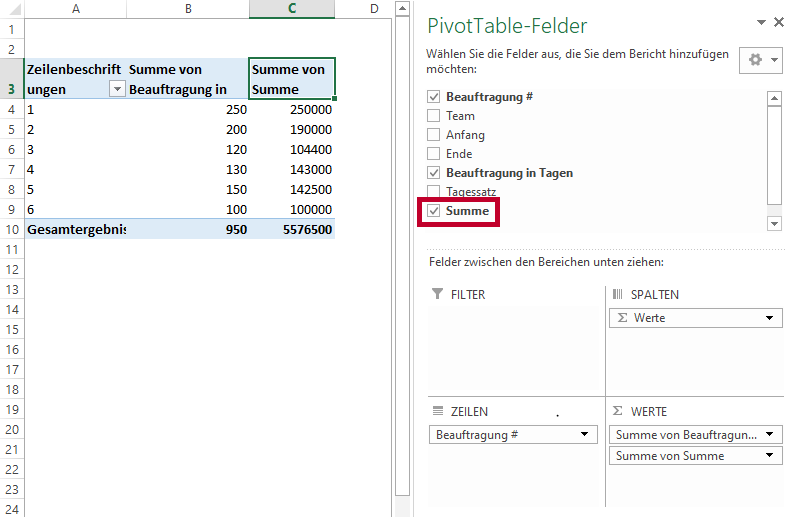
Then simply add the individual fields to the pivot using drag & drop at the appropriate point (Filter - Columns - Rows - Values):