What is Grafana?
Grafana is a well-known visualization software that can be used to quickly generate time series-based visualizations. This also requires a database such as ElasticSearch (or MySql, PostgreSQL, InfluxDB etc.) for data storage.
Grafana is cloud-based and also exists as an open source application in various versions. There are customized versions for Linux, Mac, Windows and Docker.
Data points and time series:
As a rule, Grafana is used to create visualizations of data in time series (so-called "data points"). A data point is characterized by the basic attributes "when, where, what and how much". Here is a simple example of a data point from a data center:
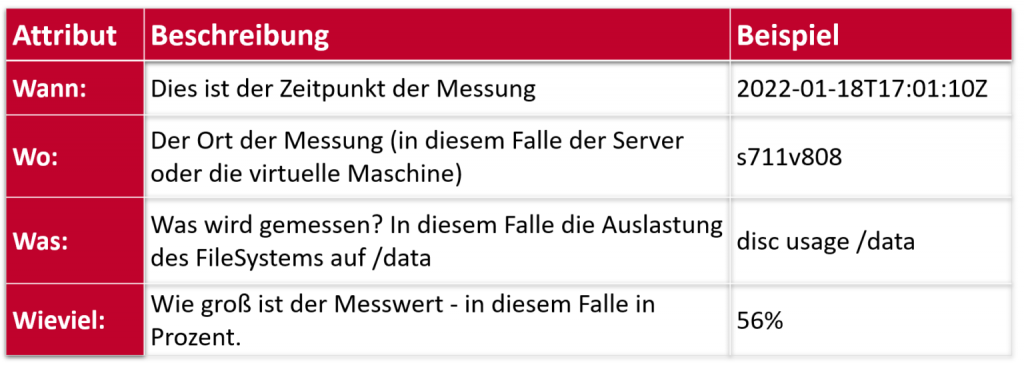
In the example of the data center, we usually have many servers and we also record many different multiple measured values ("metrics"). This data can be easily mapped and stored in the above-mentioned data points. We usually use a database that supports the storage of time series well, such as Telegraf/InfluxDB, ElasticSearch, but this is also possible with "normal" SQL databases such as MySQL, PostgreSQL, MS-SQL Server. Grafana also offers the option of directly supporting various enterprise software such as Oracle, Splunk, SAP HANA or MongoDB.
Of course, it is also possible to display completely different data series than those in the data center example. Traffic flow figures, technical process key figures, weather values, index values, etc. are conceivable.
Visualizations and dashboards:
Normally, so-called dashboards are created that contain visualizations. Grafana offers a variety of visualizations (line charts, bar charts, pie charts, gauges, status values, histograms, heat maps, tables, etc.), which can be combined and very finely adjusted. Dashboards can be linked to each other via values so that you can dive "deeper" into the data within a dashboard.
The measurement series themselves also offer a variety of methods for determining values, such as avg, min, max, sum, count, moving averages, derivatives, etc., but also basic stat. Parameters such as stdabw.
Here are some examples of dashboards:
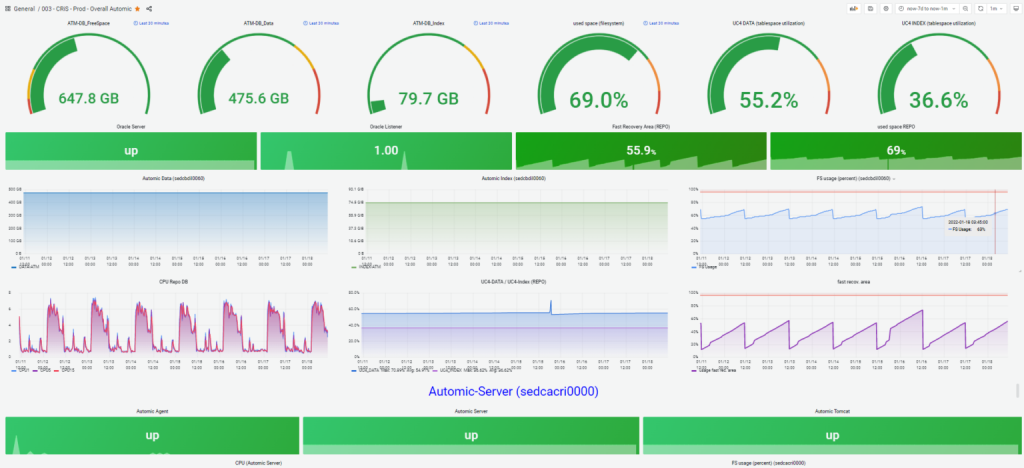
Grafana Dashbord - Overview
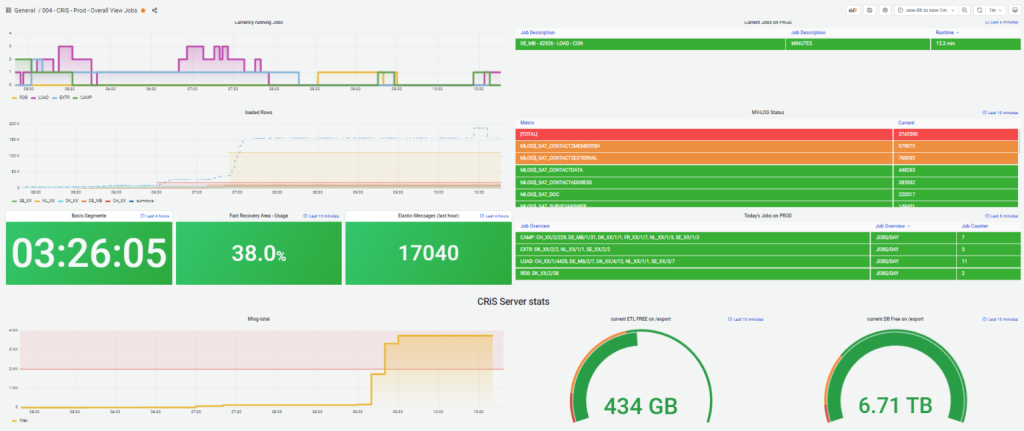
Grafana Dashboard - Detail Job View
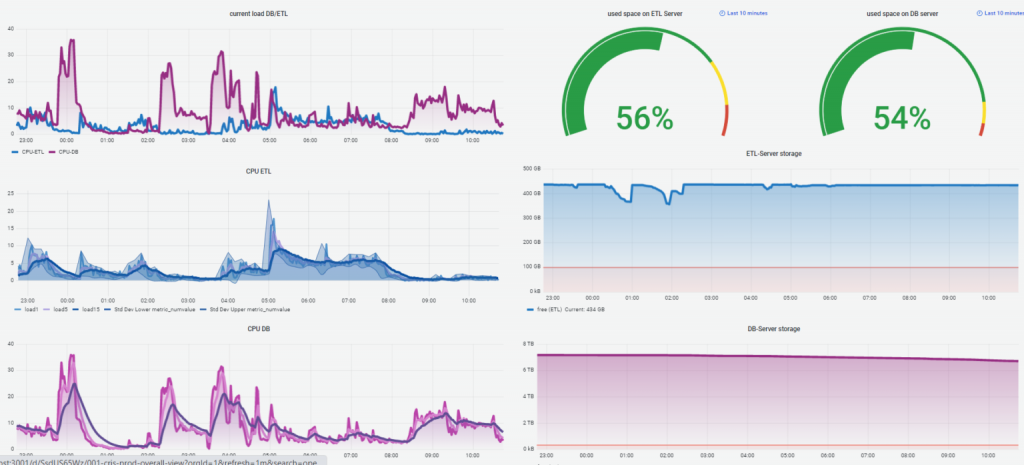
Grafana Dashboard - Utilization overview
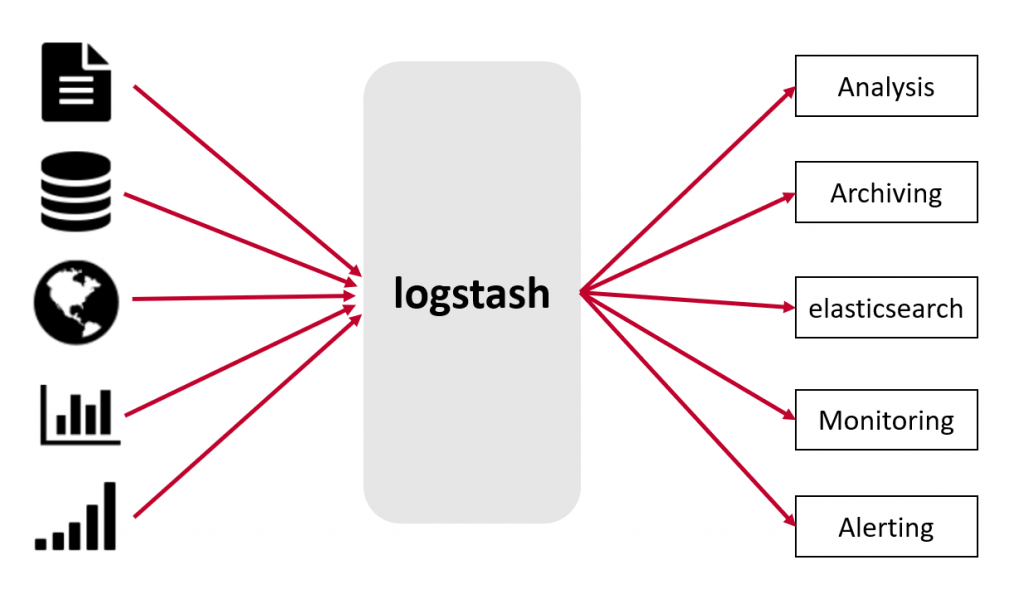
Integration with the ElasticStack:
In our implementations, we like to use the ElasticStack for capturing and reading raw data, transforming data into data points and indexing/storing data points in data series because of its stability, performance, good integration options and various plugins (for many data sources).